An orthopaedic practice generated a net patient revenue of $20 million in 2023. Is that a good number?
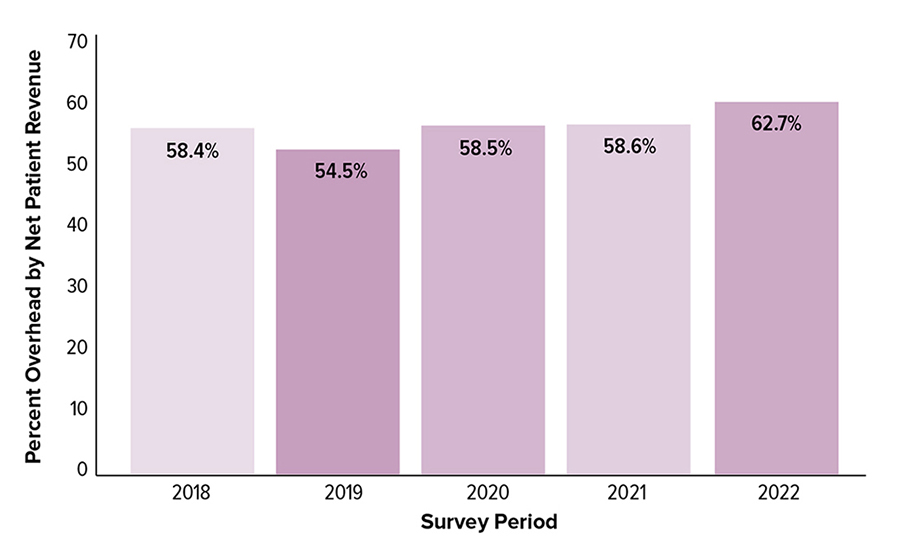
It depends! What was the practice’s overhead? What did similar practices generate? Surgeons can answer the first question by looking at their own practice data, but it takes the power of benchmarking to answer the second. For example, orthopaedic practices can compare overhead by net patient revenue for their practice compared with industry benchmarks to determine whether the practice’s overhead is appropriate given the amount of patient revenue generated (Fig. 1).


Through the day-to-day operation of an orthopaedic practice, a lot of data are generated that can be used to assess the overall performance of the practice (e.g., revenue, expenses, overhead); physician, physician assistant, and nurse practitioner productivity (e.g., patient visits, surgical cases, net collections); and operational efficiency (e.g., overhead expenses, staffing ratios). Practices can analyze those data and internally track trends over time and make comparisons among its physicians. However, it is impossible to understand how one compares to peers and competitors without access to relevant, industry-specific benchmarks. This article provides four examples of how practices have used benchmarking data to make decisions within their practices and continue to make sure their practices’ operations remain consistent with industry trends.
Without benchmarking data, decisions related to hiring additional employees can be based on competing priorities and differing perceptions. Practice administrators may want to bring in more staff to improve the efficiency of the clinic or to respond to emerging employee complaints about high workloads. Physicians might resist hiring additional employees because it results in higher overhead for the practice and lower compensation levels for them.
By bringing benchmarking data into the decision-making process, both practice administrators and physicians can base their decisions on data and continue to evaluate staffing levels within the practice. One practice was able to support the decision to hire additional billers by first identifying the average number of full-time billers in other orthopaedic practices with the same number of physicians and then documenting that the number of days in accounts receivable became more in line with industry averages.
“It was key for me to be able to take benchmarking data and see how many full-time billers we needed based on the number of providers we had,” said Olivia Wolf, practice advisor at Alaska Shoulder and Orthopaedic Institute in Anchorage, Alaska. “After we added new staff, I was able to see where we were in average number of days in accounts receivable before those staffing decisions versus 90 days later, when we had caught up to the industry average.”
Overhead
Effectively managing overhead, defined as total operating expenses before physician expenses, is important, as it directly relates to the overall success of an orthopedic practice or clinic and to physician compensation.
“To determine if you need to lower overhead, you need to determine whether there is a problem. How are you going to know if you are just looking at data from your practice?” said Terrance Rosenthal, chief executive officer of the Orthopaedic Clinic in Opelika, Alabama. “You need to be able to see what is going on regionally and nationwide in practices of the same scope and makeup. Define if there is a problem, and the only way to do this is if you have data to compare.”
Physicians and administrators look at several metrics when determining whether overhead is too high or too low and how to improve overhead performance. Specifically, overhead per physician and overhead by net patient revenue provide two ways for practices to compare their overhead levels to other orthopaedic practices. Based on those comparisons, practices can then examine overall staff cost as a percentage of revenue to determine how staffing expenses compare to the industry average and then investigate other expenses, including technology, for similar practices to identify areas in which improvements can be made.
Compensation
Orthopaedic practices need to establish fair and competitive compensation levels for their physicians, physician assistants, nurse practitioners, practice executives, and employees. Individuals regularly compare their salaries, bonuses, and benefits to their peers and to what is available in the market. Unfortunately, these comparisons do not always consider all the variables needed to make effective compensation decisions.
For orthopaedic physicians, productivity levels and practice specialty should be considered when comparing compensation amounts. Similarly, revenue, overhead, and physician productivity should be considered for practice administrator compensation, along with the size and location of the practice. When practice administrators and physicians have used benchmarking data in these areas, conversations about compensation have been more effective and less based on emotions.
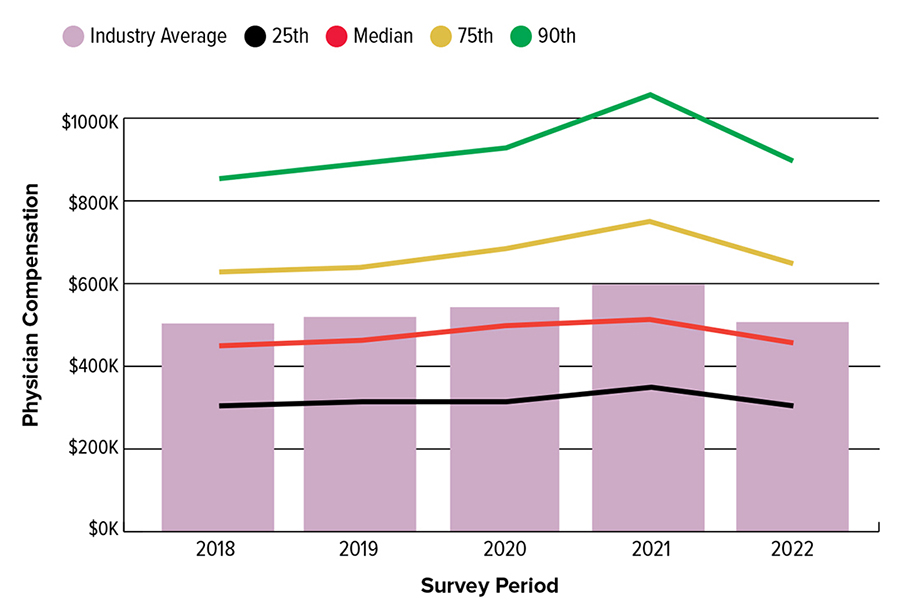
“My practice was looking at compensation by subspecialist to try realigning our overhead and how we allocate it so that physicians who were producing at a certain level of [relative value units] were receiving a similar level of compensation,” said Chris Greenman, administrator at Vail-Summit Orthopedics in Vail, Colorado. “So, we looked at the benchmarking data and if the physician was in the 75th percentile of production, then we tried to get him or her as close as we could to the 75th percentile of compensation.” One of the metrics used in this analysis was compensation per physician report (Fig. 2), which provides the industry average, median, 75th, and 90th percentile levels for several orthopaedic specialties.
Practice growth
When looking to expand by increasing the number of physicians or providers, adding locations, or introducing a new ancillary service line, physicians and practice administrators have used benchmarking data to inform the infrastructure needed to support that growth. For example, practice leaders examine the revenue, overhead, surgical cases, and patient visits for practices that match their current number of providers and practices with the number of providers that they will have after their expansion. Similarly, practices have looked at benchmarking data for physical/occupational therapy, MRI, and durable medical equipment to determine expected revenue and expense levels as well as needed staffing ratios to support those ancillary services in other practices of their size.
“We have used benchmarking data to analyze service lines, production, compensation, and efficiency within our practice. Thanks to the data available, we have made changes in our practice that have resulted in increased volumes, higher revenue, and decreased overhead across the board,” said Frazier Jones, MD, FAAOS, president and managing partner of the Orthopaedic Clinic in Opelika, Alabama.
There are many other ways that physicians and practice administrators have used benchmarking data to understand their performance, identify areas for improvement, and improve patient outcomes and operational efficiency. Using industry-specific benchmarking data takes the guesswork out of key decisions and allows orthopaedic professionals to monitor changing trends in the ever-changing healthcare environment.
The American Alliance of Orthopaedic Executives (AAOE) promotes high-quality healthcare practice management in the orthopaedic and musculoskeletal industry. AAOE provides benchmarking, advocacy, networking, education, and business development for the industry. Visit aaoe.net to learn more.
Vicki Sprague, PhD, is chief integration officer of AAOE. Since joining AAOE in 2015, Dr. Sprague has facilitated improvements in AAOE’s annual benchmarking survey, managed the implementation of a data warehouse, and promoted operational improvements throughout the association.